AI Productivity Paradox: the Model Was Never the Bottleneck
 Francis Okafor
On this page
- One 1990 paper that explains the AI productivity paradox
- What the factories actually had to do
- Group drive is what most AI adoption looks like
- What has actually been measured, and who paid for it
- Relaying the floor
- The analogy is comfortable, which is the problem with it
- The shaft nobody photographs
- Sources
Robert Solow put the most quoted sentence in productivity economics into a book review. New York Times Book Review, 12 July 1987, page 36. "You can see the computer age everywhere but in the productivity statistics." Thirty-nine years on, the AI productivity paradox is that sentence with one noun replaced. Capability is obvious. Output per hour is not.
Most people read this as a lag. Give it time, the models improve, the numbers arrive. That reading gets the mechanism backwards. In every previous case of a general purpose technology the technology itself was ready long before the gains appeared, and the thing standing in the way was not the machine. It was the shape of the work built around the machine.
The model is not the constraint. The organisation is.
One 1990 paper that explains the AI productivity paradox
Paul David wrote it up in "The Dynamo and the Computer: An Historical Perspective on the Modern Productivity Paradox", American Economic Review Papers and Proceedings, volume 80, number 2, 1990, pages 355 to 361. His claim was narrow and awkward for everyone: the delay between a general purpose technology arriving and productivity moving is not a measurement artefact and not a maturity problem. It is the time an economy needs to rebuild itself around the new input.
The formal treatment of general purpose technologies came later, in Bresnahan and Trajtenberg's 1995 Journal of Econometrics paper asking whether they are engines of growth. David got there first with a case study, and the case study is worth spelling out properly, because the part everyone skips is the part that matters.
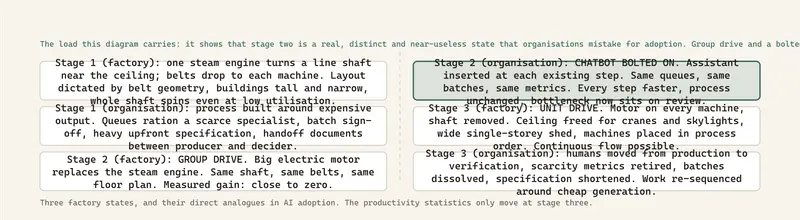
The electric motor was available for decades before it mattered. What was missing was a floor plan.
What the factories actually had to do
Pearl Street Station began generating on 4 September 1882, serving four hundred lamps for eighty-two customers in lower Manhattan from a plant whose six dynamos gave it six hundred kilowatts of installed capacity. Edison's first commercial power station in the United States dates from then, following Godalming in Surrey in 1881 and his own Holborn Viaduct station in London in January 1882. Manufacturing productivity did not move for a generation.
Warren Devine reconstructed why in "From Shafts to Wires: Historical Perspective on Electrification", Journal of Economic History 43(2), June 1983, pages 347 to 372. A steam-powered factory had one prime mover. Power reached the machines through a line shaft, a rotating steel bar running the length of the building near the ceiling, with leather belts dropped down to each machine. Everything about the building followed from that bar.
Machines had to sit near the shaft, so the floor plan was set by belt geometry rather than by the order of operations. Buildings went up rather than out, tall and narrow, because shafts had practical length limits. The entire shaft turned whenever any single machine ran, so a plant at ten per cent utilisation still paid the friction of the whole line. The ceiling was full of moving steel and leather, which meant no overhead crane and very little natural light. Belts killed people.
First move on electrification: remove the steam engine, put a large electric motor in its place, turn the same shaft. This was called group drive. Cheap, fast and almost entirely pointless, because the shaft was still the shaft and the floor plan was still the floor plan. New power source, unchanged organisation.
The gain came from unit drive. A small motor on each machine, shaft removed completely. That released the ceiling. With no shaft overhead you could hang a crane, cut skylights, build a wide single-storey shed instead of a narrow tower and, most of all, place machines in the order the work actually flowed. Sequence replaced geometry. Continuous flow became physically possible.
None of that is an electricity purchase. It is new buildings, new capital, new supervisory practice, new job definitions and a workforce that had never worked that way. David's argument is that this is why roughly four decades separate Pearl Street from the manufacturing productivity surge of the 1920s. Treat the forty years as his framing of two dated endpoints rather than a measured constant. Nobody has established a natural adjustment period for anything.
Group drive is what most AI adoption looks like
Bolting a chatbot onto an unchanged process is group drive. Same shaft, new motor.
The pattern repeats with almost no variation. A team has a process built when some output was expensive: written analysis, code, a first-draft contract, a support reply. The process is full of machinery that exists only because that output was expensive. Queues, because you were rationing a scarce specialist. Batch sign-off, because reviewing was cheaper in bulk. Heavy upfront specification, because rework cost more than planning. Handoff documents, because the person producing and the person deciding sat at different desks.
Then generation gets cheap, and the response is to insert an assistant at each existing step while leaving the queues, the batches, the specification ritual, the handoffs and the metrics exactly where they were. Every step gets faster. The process does not.
Worse, the assistant frequently loads the bottleneck. If a team could produce ten drafts a week and review twelve, generation was the constraint. Make generation five times faster and the constraint moves to review, which has not changed at all. Now there is a queue where a workflow used to be, and a reviewer drowning in it. Local speedup, aggregate slowdown.
What has actually been measured, and who paid for it
Adoption is genuinely fast. Bick, Blandin and Deming, NBER working paper 32966 (September 2024, revised February 2025), find close to forty per cent of Americans aged eighteen to sixty-four using generative AI, twenty-three per cent of employed respondents using it for work at least weekly and nine per cent daily. Work adoption is tracking the personal computer's early pace and overall adoption is running ahead of both the PC and the internet. Their estimate of time actually saved: about 1.4 per cent of total work hours. Enormous uptake, small measured saving.
The Danish evidence is sharper because it uses administrative records rather than self-report. Humlum and Vestergaard, NBER working paper 33777 (May 2025, revised March 2026), link surveys of 25,000 workers across 7,000 workplaces to Danish administrative records and find precise null effects on earnings and hours at both worker and workplace level, ruling out effects larger than two per cent two years after ChatGPT launched. Their explanation is this entire argument in one clause: employers absorb the technology through task reorganisation. The work changed shape before it changed the numbers.
Then the result nobody selling anything wants to cite. METR, a nonprofit evaluation lab, published a randomised controlled trial on 10 July 2025 with sixteen experienced open source developers across 246 real repository issues. With AI tools they were nineteen per cent slower. They had forecast twenty-four per cent faster. After finishing, having actually been slower, they still believed they had been about twenty per cent faster. METR is careful about the limits: small sample, mature codebases the developers knew deeply, one moment in tooling. It does not show AI slows people down generally. It does show that perceived speedup and measured speedup can point in opposite directions, which should make you suspicious of every self-reported productivity figure you read, the 1.4 per cent above included.
On the macro side, Daron Acemoglu's task-based estimate, NBER working paper 32487 (May 2024), puts the total factor productivity gain at no more than 0.66 per cent over ten years, revised down to under 0.53 per cent once harder tasks are allowed for. Nontrivial, modest, not a discontinuity.
Against all of this sits the productivity J-curve of Brynjolfsson, Rock and Syverson, NBER working paper 25148 (2018, revised 2020). Early years of a general purpose technology systematically understate productivity because the complementary investment is intangible and goes unrecorded. Firms are building the thing that pays later and the national accounts cannot see it. That may be exactly what these nulls are.
One caution about numbers in circulation. The figure that spread fastest in 2025 was that ninety-five per cent of enterprise AI pilots fail, from "The GenAI Divide: State of AI in Business 2025", published by MIT's NANDA initiative in August 2025. The figure that spread fastest in 2025 was that ninety-five per cent of enterprise AI pilots fail, from "The GenAI Divide: State of AI in Business 2025", dated July 2025 and issued by MIT's NANDA initiative. Its base is 52 structured interviews, survey responses from 153 leaders and a review of more than 300 publicly disclosed AI initiatives, and the report's own limitations section flags selection bias and declining participation among the organisations approached. It is a directional observation from a small self-selecting sample. It is not a measured failure rate, and it gets quoted as one constantly.
Relaying the floor
Real reorganisation is not a procurement decision. It looks like this.
Move the human to the point of judgement. If generation is cheap and verification is not, verification is the job. People who used to produce now decide, which is a different skill, a different seniority curve and often a different person. Some of your strongest producers will be weak verifiers. That is a staffing problem, not a tooling one.
Retire the metrics that measured scarcity. Tickets closed, documents produced, lines written, calls handled. Every one of those counted something that used to be hard. Keep measuring them after it becomes easy and you will get precisely what you asked for, in volume, and none of it will matter.
Dissolve the batch. Line shafts forced batching because reconfiguring belts was expensive. Most organisational batching exists for the same reason: a scarce reviewer, a weekly release, a monthly report cycle. Once the expensive step stops being expensive, the batch is pure latency.
Accept a visible decline. The J-curve is an accounting fact, not a metaphor. The period during which you rebuild is a period in which your measured numbers look worse. Any leader who cannot politically survive two bad quarters will not attempt any of this, which is why most of the reorganising will be done by firms with no process to defend.
The analogy is comfortable, which is the problem with it
Here is the strongest case against everything above, and I do not think it can be waved off.
Electrification was slow because it was made of steel and concrete. Relaying a factory floor meant new buildings, and buildings run on a capital cycle measured in decades. You could not move faster than the construction industry. Software has no such floor. Deploying a model is an API call and reconfiguring a workflow is a change that ships on a Tuesday.
The adoption data supports this. Bick, Blandin and Deming find generative AI diffusing faster than the PC or the internet, and both of those diffused faster than electric motors did. If the complementary assets this time are mostly software, process documentation and training rather than real estate, the adjustment could be one decade rather than four. Possibly less.
There is a worse version of the objection and it is aimed at people like me. The electrification analogy is enormously comforting to incumbents. It tells every organisation that has not reorganised that the payoff is decades away and history is on their side. It converts inaction into patience. A firm about to be displaced would find no story more soothing, and when a story soothes exactly the people it ought to alarm, that is usually a sign it is being used rather than tested. David's paper describes what happened once. It licences nobody to assume the same pace.
My position is a partial concession. The counter is right about the tooling. Where I think it underrates the difficulty is the human layer: reporting lines, incentives, the definition of a job and the authority to declare a step unnecessary. Those move at the speed of internal politics, which nothing has accelerated. But "slower than software, faster than concrete" is a very wide range and I cannot tell you where in it we currently sit. Neither can anyone quoting the forty years at you.
The shaft nobody photographs
Shenzhen is a useful place to watch this, because the hardware and the factory floor are both still physically present. You can stand in a plant laid out in the last five years around what the work needs, then stand in one where the layout was inherited and everything since has been an accommodation. The second kind buys better machines. It does not get better output.
The tension I cannot resolve is about who wins. If the binding constraint is organisational rather than technical, the advantage belongs to whoever has the least existing process to defend. That is an argument for young firms and it is an argument for places outside the incumbent centres, including the African markets I spend most of my time thinking about. No line shaft to remove.
But an absence of legacy process is also an absence of what makes reorganisation pay: the capital, the data, the customer base and the institutional patience to run at a loss while the floor is being relaid. The firms with nothing to unbuild usually have nothing to rebuild with either.
Electricity is not what changed the factory. Taking down the ceiling did.
Sources
Productivity paradox: Solow's 1987 quote and Paul David's 1990 AER paper (citation details): https://en.wikipedia.org/wiki/Productivity_paradox
Warren D. Devine, "From Shafts to Wires: Historical Perspective on Electrification", Journal of Economic History 43(2), June 1983, 347-372 (cited in): https://en.wikipedia.org/wiki/Electrification
Pearl Street Station: first generation 4 September 1882: https://en.wikipedia.org/wiki/Pearl_Street_Station
Bick, Blandin & Deming, "The Rapid Adoption of Generative AI", NBER WP 32966 (Sept 2024, rev. Feb 2025): https://www.nber.org/papers/w32966
Humlum & Vestergaard, "Still Waters, Rapid Currents: Early Labor Market Transformation under Generative AI", NBER WP 33777 (May 2025, rev. March 2026): https://www.nber.org/papers/w33777
METR, "Measuring the Impact of Early-2025 AI on Experienced Open-Source Developer Productivity", 10 July 2025: https://metr.org/blog/2025-07-10-early-2025-ai-experienced-os-dev-study/
Daron Acemoglu, "The Simple Macroeconomics of AI", NBER WP 32487 (May 2024): https://www.nber.org/papers/w32487
Brynjolfsson, Rock & Syverson, "The Productivity J-Curve", NBER WP 25148 (2018, rev. 2020): https://www.nber.org/papers/w25148
Frequently Asked Questions
What is the AI productivity paradox?
It is the gap between visible AI capability and the absence of matching gains in measured output per hour. The name comes from Robert Solow's 1987 remark about computers being visible everywhere except in the productivity statistics, published in the New York Times Book Review on 12 July 1987.
How long did electrification take to raise factory productivity?
Paul David's 1990 American Economic Review paper frames it as roughly four decades, from Pearl Street Station generating on 4 September 1882 to the manufacturing productivity surge of the 1920s. That figure is his framing of two dated endpoints rather than a measured constant, and no established natural adjustment period exists for general purpose technologies.
Is there hard evidence that AI raises productivity yet?
The best non-vendor evidence is mixed. Bick, Blandin and Deming (NBER 32966) find self-reported savings of about 1.4 per cent of work hours. Humlum and Vestergaard (NBER 33777) find precise null effects on Danish earnings and hours, ruling out anything larger than two per cent. METR's July 2025 randomised trial found sixteen experienced developers were nineteen per cent slower with AI tools while believing they were faster.
What did the MIT 95 per cent AI pilot failure figure actually measure?
It comes from "The GenAI Divide: State of AI in Business 2025", dated July 2025 and issued by MIT's NANDA initiative, based on 52 structured interviews, survey responses from 153 leaders and a review of more than 300 publicly disclosed AI initiatives. The higher figures quoted across the press, 150 interviews and 350 employees, do not appear in the report at all. It is a directional observation from a small self-selecting sample, not a measured failure rate. It is a directional observation from a small self-selecting sample, not a measured failure rate.
What does genuine organisational reorganisation around AI look like?
Moving humans from production to verification, retiring metrics that counted scarce output, dissolving batches that existed only because a specialist was scarce and accepting a period of visibly worse measured numbers while the rebuild happens. None of it is a purchase.