AI in Supply Chain: The Dull Wins and the Forecasting Trap
 Francis Okafor
On this page
- Demand forecasting AI is the part least willing to improve
- The document burden of one cross-border order
- Lead time variance moves more inventory than forecast error
- Twenty orders that need attention, not two thousand
- Translation is a sourcing function
- Bullwhip amplification and the limits of supply chain visibility
- The planner with a spreadsheet usually wins
- What the AI in supply chain demo never shows
- Sources
Every pitch for AI in supply chain opens on the same slide. Demand forecasting. A jagged blue line for what happened, a smooth orange one laid over it, the orange line closer. Then a number: error down thirty per cent, inventory down twenty, stockouts halved. I have sat through that slide in Shenzhen and in rooms far from it, and the pitch always aims at the same node in the chain. It is usually the node least able to move.
The gains that survive contact with an operations team are duller. Pulling fields out of a customs declaration. Noticing that a supplier's promised lead time has been drifting for four months. Cutting a book of two thousand open orders down to the twenty a planner should actually look at today. Translating a spec sheet at eleven at night so a decision does not wait until morning. None of that photographs well.
The reason is not that forecasting models are bad. It is that demand is mostly driven by things that were never in the demand history.
Demand forecasting AI is the part least willing to improve
The best public evidence is the M5 competition, run on Walmart daily sales with prices and calendar events supplied. The winning submission beat the strongest of twenty-four benchmarks by about 22 per cent on the competition's weighted error measure, and all of the top fifty beat it by more than 14 per cent. Machine learning won cleanly. That result is real, and it is also close to a ceiling: a large clean dataset, a stable retail category, exogenous variables handed to you, and thousands of teams optimising for months against a fixed target.
Read the fine print. The organisers noted that the differences between methods narrowed at lower levels of aggregation. Lower aggregation is where ordering happens. Nobody places a purchase order at the national category level.
Then the number the vendors use. The most quoted figure in this market comes from McKinsey: AI-driven forecasting can cut errors by twenty to fifty per cent. It is a consulting estimate rather than a controlled comparison, and the words missing from it are "against what". A percentage improvement is only as impressive as its baseline.
Which brings in the least flattering piece of research in the field. Steve Morlidge examined forecasts from eight supply chain companies and found that around 52 per cent of them were less accurate than a naive forecast, the one you get by assuming next period resembles this one. More than half of professional forecasting effort was destroying accuracy rather than adding it. Against a baseline like that, a forty per cent error reduction is not evidence that a model is clever. It is evidence that the old process was worse than doing nothing.
And the structural reason underneath all of it. A sales history contains what your customers bought. It does not contain a competitor's unannounced promotion, a tariff decision, a viral clip, a port closure, a currency move, or a buyer at a distributor deciding to hit a quarterly target. Those things move demand. A bigger model does not conjure them.
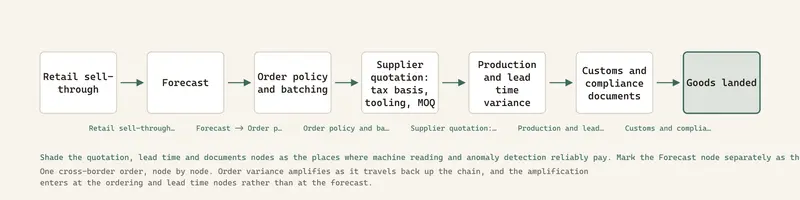
A percentage improvement is only as impressive as its baseline, and more than half of professional forecasts are beaten by assuming next period looks like this one.
The document burden of one cross-border order
Consider what a single order from a Chinese factory produces on paper.
It starts with a quotation, often an Excel file attached to a chat message. The price is quoted tax-inclusive or tax-exclusive, and a buyer who does not ask which is comparing two numbers that are not comparable. China's standard VAT rate is 13 per cent, so the gap is not a rounding difference. There is a tooling charge for the mould, sometimes billed once, sometimes amortised across the first order, sometimes refundable above a volume threshold. There is a minimum order quantity. There is a lead time in working days that starts either from deposit or from sample approval, and those two dates can sit weeks apart. There is a trade term, and EXW Shenzhen and FOB Yantian describe different amounts of the buyer's money.
Then the order runs and the paperwork arrives. Proforma invoice, sales contract, packing list, commercial invoice, customs declaration carrying an HS code that sets the duty, certificate of origin, third party inspection report, test reports against the destination market's standards, bill of lading. On the Chinese side, the fapiao and the export rebate filing. Trade facilitation work puts an average cross-border transaction at twenty to thirty parties, roughly forty documents and about two hundred data elements, many of them repeated across forms.
The rebate is not static either. From 1 December 2024 China cut the export tax rebate from 13 to 9 per cent on refined oil, photovoltaic products, batteries and certain non-metallic mineral products, and removed it outright for aluminium and copper products. A quoted price can move for reasons that have nothing to do with the factory. If your comparison sheet does not record which basis each quote sits on, your sourcing decision is noise wearing a decimal point.
This is where machine reading genuinely pays. Extract the fields from the quotation, the invoice and the inspection report. Normalise them onto one basis. Flag that supplier A quoted tax-exclusive EXW while supplier B quoted tax-inclusive FOB with tooling amortised. The task is extraction and normalisation, not prediction, and it has the property every deployable feature needs: a human can check the output against the source in seconds. A wrong extraction is visible immediately. A wrong forecast is visible in four months, by which point nobody is checking.
Lead time variance moves more inventory than forecast error
Safety stock is driven by two variances, demand and lead time, and for anyone sourcing across an ocean the second is usually the larger. A supplier who is consistently twelve days late is easy to plan around. A supplier who is on time, on time, on time, then twenty-six days late is the expensive one. Consistency beats speed.
Detecting drift in that pattern is a far easier machine learning problem than forecasting demand. You are not predicting a future the data does not contain. You are saying: this run of promised-versus-actual dates does not look like the last two hundred. Anomaly detection has a defined baseline, a fast feedback loop and an obvious owner.
The signals are mundane. Quoted lead times creeping up across every new quotation from one factory. Inspection reports landing later in the production window. Sample approvals taking longer. Payment terms tightening, which usually means the factory's own suppliers have tightened theirs first. Surfacing those before they become a missed sailing shifts more inventory than five points of forecast accuracy ever will. The Spring Festival shutdown is on every calendar in China and still catches out planning systems that treat it as a surprise.
Twenty orders that need attention, not two thousand
A planner makes perhaps two dozen real decisions in a day. The open order book has thousands of lines. Most planning software answers this by generating a plan and asking the planner to trust it, which they will not do, partly because they have been burned before and mostly because they cannot audit it.
The version that works inverts the request. Do not produce the plan. Produce the queue. These twenty lines need a human today, ranked, each with the reason attached and the evidence one click away. The model does not have to be right. It has to beat sorting by order value or by date, which is the actual competition, and that is a low bar.
The failure mode is precision, not recall. A queue of three hundred exceptions is a queue nobody opens. Two weeks of that and the planner is back in the spreadsheet while the system lives on in a quarterly slide.
Translation is a sourcing function
Cross-border sourcing runs in two languages and increasingly inside a chat app rather than email. Specifications, GB national standards, material certificates, voice notes from a production manager. For years the bottleneck was not translation quality. It was queueing, waiting for the one person on the team who reads Chinese to be free.
Machine translation removed the queue. That is the gain, and it is bigger than it sounds, because it turns a two day round trip into a two minute one. Read the spec, understand it, ask the clarifying question in the same sitting.
It does not remove the risk. Trade and tax vocabulary is exactly where machine translation fails quietly. 含税 and 不含税, 开票, 打样费, 模具费. Each maps to a commercial position, and a plausible mistranslation reads perfectly well in English while committing you to a different number. The contract still needs someone who reads the original. The working loop does not.
Bullwhip amplification and the limits of supply chain visibility
Lee, Padmanabhan and Whang named four causes of the bullwhip effect in 1997: demand signal processing, order batching, price variation with promotions, plus rationing behaviour when supply runs short.
One of those four is forecasting. The other three are ordering policy and human incentive. A better forecast at your node does not shrink your supplier's batch size. It does not stop your customers over-ordering during an allocation, and it does not remove the promotional spike your own sales team creates at every quarter end.
Chen, Drezner, Ryan and Simchi-Levi quantified this in 2000 and found that centralising demand information reduces the amplification without eliminating it, and that distortion grows with lead time. A quarter of a century on, nothing has overturned it. Amplification is structural. It is a property of how orders are placed rather than of how well demand is predicted.
Which leaves the constraint that actually binds: firms will not share data across their own boundaries. In a 2021 McKinsey survey just under half of supply chain executives said they understood where their tier one suppliers sat and what risks those suppliers faced. Two per cent could say the same about tier three and beyond.
The reason is not technical. Your demand forecast is your supplier's negotiating information. A factory that knows your true urgency prices accordingly, and a buyer who knows a factory's idle capacity does the same. Both sides understand this perfectly. It is why the supply chain visibility category mostly sells a better view of things you already own, your own purchase orders, your own containers, a carrier feed. Useful. Not a view of the tier that will actually break.
The planner with a spreadsheet usually wins
Here is the strongest argument against everything above, and it deserves to be stated at full strength. For a mid-sized importer with a few hundred SKUs and thirty suppliers, a competent planner with a spreadsheet and real relationships at the factories will outperform a bought system. Not marginally. Consistently.
The planner holds the information the model does not. They know the factory owner has just committed capital to a second line. They know a customer's big forecast is a negotiating posture. They know which supervisor to call when a shipment needs to move up a schedule. That last one matters most: when capacity is tight, position in the production queue is allocated by relationship, and no model moves you up it.
The cost side is worse than the licence fee. Any implementation consumes months of exactly that planner's attention, and the planner is the scarce asset. MIT's Project NANDA reported in 2025 that around ninety-five per cent of enterprise generative AI pilots showed no measurable effect on profit and loss. That study is directional rather than controlled, built from executive interviews, a modest survey and a scan of public deployments, but the mechanism it points at is familiar: the failure sat in the approach rather than in model quality.
So the honest test is volume, not intelligence. Automation earns its place when the routine reading, sorting and re-keying exceeds what the team can physically get through, not when somebody believes a model will out-think them. A firm placing a few dozen orders a month does not have a document problem. A firm placing several hundred does, and it has had one for years without naming it.
What the AI in supply chain demo never shows
There is a quick test for any pitch in this category. Ask what the system does with a photographed inspection report that arrives at eleven at night, in Chinese, slightly out of focus, with the buyer's part number handwritten in the margin. If the answer is a roadmap item, the product is a forecasting product wearing an operations costume.
Ask the second question too. Ask what happens when the supplier declines to share their production schedule. Because they will decline.
The awkward part is that the durable wins are also the cheap ones. Document extraction, drift detection on lead times, a ranked exception queue, translation inside the working loop: those are weeks of engineering on top of models anyone can rent, which makes them a poor thing to build a category around. Forecasting survives as the headline because it is the only part of the chain grand enough to carry a seven figure price. And the constraint that would help everyone, two firms agreeing to see each other's real numbers, is the same one Lee and his co-authors wrote up in 1997. Nobody has shipped a model for trust.
Sources
Makridakis, Spiliotis & Assimakopoulos, M5 accuracy competition: results, findings and conclusions, International Journal of Forecasting (2022): https://www.sciencedirect.com/science/article/pii/S0169207021001874
Lee, Padmanabhan & Whang, Information Distortion in a Supply Chain: The Bullwhip Effect, Management Science 43(4), 1997: https://courses.ie.bilkent.edu.tr/ie460/wp-content/uploads/sites/12/2019/02/Lee-Padmanabhan-Whang-1997-MS.pdf
Chen, Drezner, Ryan & Simchi-Levi, Quantifying the Bullwhip Effect in a Simple Supply Chain, Management Science 46(3), 2000: https://pubsonline.informs.org/doi/10.1287/mnsc.46.3.436.12069
SAS, Forecast Value Added Analysis: Step by Step (Morlidge finding on forecasts worse than a naive model): https://www.sas.com/content/dam/SAS/en_us/doc/whitepaper1/forecast-value-added-analysis-106186.pdf
McKinsey, Future-proofing the supply chain (2021 survey on tier three visibility): https://www.mckinsey.com/capabilities/operations/our-insights/future-proofing-the-supply-chain
World Bank / UNESCAP, Legal Aspects of Cross Border Trade Facilitation (parties, documents and data elements per transaction): https://www.unescap.org/sites/default/d8files/event-documents/Legal%20Aspects%20of%20Cross%20Border%20Trade%20Facilitation_World%20Bank.pdf
China Briefing, China lowers the export tax rebate rate for certain products (effective 1 December 2024): https://www.china-briefing.com/news/navigating-chinas-latest-export-tax-rebate-adjustments-implications/
Forbes coverage of MIT Project NANDA, The GenAI Divide: State of AI in Business 2025: https://www.forbes.com/sites/jasonsnyder/2025/08/26/mit-finds-95-of-genai-pilots-fail-because-companies-avoid-friction/
Frequently Asked Questions
Does AI actually improve demand forecasting accuracy?
Yes, measurably, but by less than the marketing implies. In the M5 competition, run on Walmart daily sales data with prices and calendar events provided, the winning machine learning submission beat the strongest of twenty-four benchmarks by about 22 per cent on the competition's weighted error measure, and all of the top fifty beat it by more than 14 per cent. Those margins narrowed at lower levels of aggregation, which is exactly where purchase orders get placed. Large gains reported in industry are often measured against a baseline that was already performing worse than a naive forecast.
Where does AI reliably help in a supply chain?
Four places hold up in practice: extracting structured fields from quotations, invoices, customs declarations and inspection reports; anomaly detection on supplier promised-versus-actual lead times; exception triage that ranks the small number of orders needing a human today; and translation inside the day-to-day sourcing loop. They share one property. The output can be checked against a source document in seconds, and none of them requires predicting events that were never in the data.
Can better forecasting fix the bullwhip effect?
No. Lee, Padmanabhan and Whang identified four causes in 1997, and only one of them is demand signal processing. The others are order batching, price variation with promotions, and rationing behaviour when supply is short. Chen, Drezner, Ryan and Simchi-Levi showed in 2000 that centralising demand information reduces the amplification without eliminating it, and that distortion grows with lead time. The amplification lives in ordering policy and incentives, so a better model at one node does not repair the node above it.
What do supply chain visibility tools actually show you?
Mostly data you already own: your purchase orders, your shipments, a carrier feed, sometimes a tier one supplier portal. That is genuinely useful for exception handling. It is not visibility into the tier where disruptions usually start. In a 2021 McKinsey survey, just under half of supply chain executives said they understood their tier one suppliers' locations and risks, while only 2 per cent could say the same about tier three and beyond. The gap is an incentive problem between firms, not a software gap.
Is AI worth buying for a mid-sized importer sourcing from China?
It depends on document volume rather than ambition. At a few dozen orders a month, a competent planner with a spreadsheet and real relationships at the factories will beat a bought system, because they hold information no model has, including who to call to move up a production queue. The economics change when routine reading, sorting and re-keying exceeds what the team can physically process. At that point extraction and triage pay for themselves, and demand forecasting is still the wrong place to start.